As prices for food and household items have jumped over the last couple of years, there also seems to be a trend where companies have reduced the size of their packages, while charging similar amounts as before. And the Bureau of Labor Statistics has also been noticing, as they put out
a recent report explaining how they account for so-called "shrinkflation".
The BLS determines the Consumer Price Index and other inflationary items by figuring a "basket" of goods and services, and then comparing total prices over time, as well as the individual prices of a massive number of products. And the BLS explains how they adjust for increases or decreases in product size, to get a fair comparison.
Our economists continuously review goods and services in the CPI. They identify product downsizing through monthly reviews of CPI data and online research. For products data collectors identify with a size or weight change, economists will conduct further research on the manufacturers’ websites, online shopping websites, and other sources to verify if the product is experiencing product downsizing or upsizing. Once the economist has verified that the item is experiencing product size change, they will notate the item and search the CPI sample for the same item. To ensure downsizing is captured in a timely manner, the economist will notify the data collectors that a product is experiencing downsizing so that they can be on the lookout for a size change.
Data collection procedures vary for different products and services; therefore, the impact of product size change is handled differently based on the item. An effective price per standard size, usually a price per ounce, is calculated for items where size is reported. The effective price per ounce is the collected price divided by size. For example, if a half-gallon (64 oz) of Brand A vanilla ice cream is priced in January 2021 at $5.99, then the effective price per ounce is $5.99 divided by 64 oz or $0.093 per ounce. If, in February 2021, the same Brand A vanilla ice cream is reduced in size to 60 oz, but the price is still $5.99, the effective price per ounce would be $0.0998 per ounce. This results in a 6.7-percent increase in the price per ounce of the ice cream, and the CPI would include this price increase. Our economists even adjust for items that do not have a weight, like toilet paper. For example, when the number of sheets per toilet paper roll changes from 220 per roll to 200, the economist will adjust the data to show a 10-percent price-per-sheet increase.
CPI economists track identified downsizing and upsizing in the CPI sample each month. Chart 1 displays the item categories with the most downsized and upsized observations in the CPI sample from January 2015 to December 2021. Household paper products experienced upsizing and downsizing more than any other category in the sample with 716 total reports during 2015–21. While that sounds substantial, it is only about 3 percent of the price observations for that category during the 7-year period. Snacks experienced the largest number of size changes for food items, with a total of 509, followed by sweetrolls, coffee cake, and donuts, tea and pies, tarts, and turnovers. For food items, 2.9 percent of observed prices experienced downsizing and upsizing.
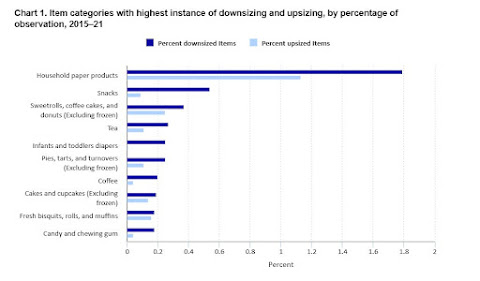
I think we all can vouch for the shrinkflation on snacks. Remember when chips and similar types of salty snacks had 10-12 ounces as a typical size instead of the 7-9 ounce package we see all the time today? Cereal also seems to have gone to smaller boxes in recent years.
Unfortunately, this report only goes through 2019 on the overall CPI changes that they can measure, so we aren't seeing the reaction to higher inflation and COVID-era changes that have happened in the last 3 years, but even so, the BLS says that several types of products had their CPIs adjusted due to changes in product size.
Table 2 focuses on the indexes where downsizing and upsizing significantly impacted item categories. Indexes that experienced the largest price increase due to downsizing were baby food (+2.81 percent); snacks (+2.64 percent); fresh biscuits, rolls, muffins (+1.59 percent); candy and chewing gum (+1.35 percent), and household paper products (+1.30 percent). Snacks, such as potato chips, saw frequent downsizing of their snack packs from 4.5 oz. to 4.25 oz. and an 8 oz. bag declining to 7.5 oz. Conversely, canned fruits and vegetables saw an increase in the research index as the effective price decrease due to upsizing was removed from the research indexes. The average total difference across all categories during the time period was 0.08 percent.

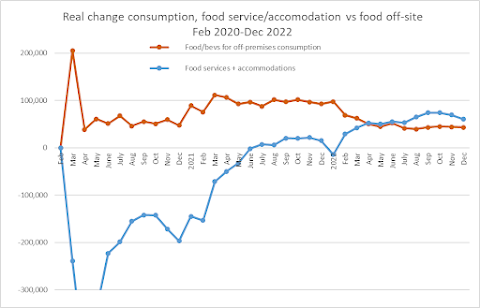
This downsizing effect may help explain how inflation-adjusted spending for "food at home" has declined over the last year, as the CPI increase for those items hit multi-decade highs. People might be buying smaller sizes (consciously or otherwise) and/or choosing cheaper types of products to adjust to the rise in prices.
Seems like something to keep an eye on, both to see if the downsizing effect continues to keep CPI higher for food and other household items, and to see if profits from those companies rise, as they're able to put in less product and charge the same prices.
No comments:
Post a Comment