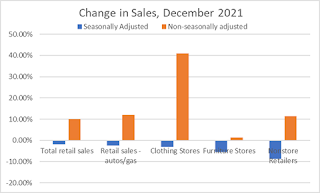
The $95.2 billion decrease in current-dollar PCE in December reflected a decrease of $147.2 billion in spending for goods that was partly offset by a $52.0 billion increase in spending for services. Within goods, decreases were widespread across most components and were led by recreational goods and vehicles, "other" nondurable goods (which includes newspapers, household supplies, and games and toys), and furnishings and durable household equipment. Within services, the largest contributor to the increase was spending for health care.The amount of consumer spending was further lowered in this report as November’s spending growth was adjusted down from 0.6% to 0.4%, below the 0.6% rate of inflation for that month. But we've also seen recent reports from the National Retail Federation that said 2021 was a record year for Holiday shopping. So what gives? Looks like it’s all a matter of when people shopped, as “Holiday shopping” isn’t just happening between Thanksgiving and Christmas anymore.
“We closed out the year with outstanding annual retail sales and a record holiday season, which is a clear testament to the power of the consumer and the ingenuity of retailers and their workers,” NRF President and CEO Matthew Shay said. “Despite supply chain problems, rising inflation, labor shortages and the omicron variant, retailers delivered a positive holiday experience to pandemic-fatigued consumers and their families. Consumers were backed by strong wages and record savings and began their shopping earlier this year than ever before. This is, in part, why we saw a decline in sales from November to December. NRF expects further growth for 2022, and we will continue to focus on industry challenges presented by COVID-19, the supply chain, labor force issues and persistent inflation. The numbers are clear: 2021 was an undeniably outstanding year for retail sales.”And if you widen the numbers out to the recent past, that bears that out. August, September and October were outstanding on a seasonally-adjusted basis, and it likely reduced the amount of added sales that we typically see for November and December, which goes in the books as a “decline". The spike in omicron cases didn’t start kicking in until mid-December, so it likely did not have a big effect on that month’s numbers. But what about January? These figures from FiveThirtyEight’s Nate Silver aren’t a good sign, at least for the restaurant industry.
That being said, a decline in customers compared to 2019 doesn't necessarily mean that we are back in the depths of last year's COVID Winter, which saw sales at bars and restaurants be more than 9% lower than 2 years prior....BEFORE inflation. While it's not the month-to-month comparison that Silver makes, it is worth remembering that January has a dropoff in spending anyway. For example, look at the Census figures from another January affected by COVID and cold weather, and even the pre-COVID Dec-January change before then. The Census bureau counts on a significant drop-off in spending, so how much of January's decline is omicron, and how much of it is a typical January? Double-digit declines are a lot, and likely will reflect in some kind of decline, but let’s not panic too much at this point. In fact, this month’s slowdown may prove to be useful in leveling out the shortages in certain industries, as that was a common complaint even before omicron started keeping some workers at home. It can make the re-set easier as omicron (hopefully) fades in February, and get us back toward some balance and good growth by the end of Q1 2022. So while the omicron effect is certain to create a headwind that slows an economy that had 6.9% growth after inflation in Q4 2021, let’s not panic too much about it unless we’re seeing those numbers stay low for the next couple of months. Let’s all do our part to diminish omicron and let’s get back toward normal, shall we?OpenTable restaurant reservations in January 2022 as compared with January 2019:
— Nate Silver (@NateSilver538) January 25, 2022
Miami: +14%
Las Vegas: +1%
Houston: -13%
Denver: -26%
LA: -41%
Boston: -48%
Brooklyn: -55%
DC: -59%
Manhattan: -64%
San Francisco: -66%
Cambridge, MA: -75%https://t.co/KWA3Itdp1J https://t.co/AMhGAZPtd8


