The US economy lost 20.5 million jobs in April, the Bureau of Labor Statistics said Friday — by far the most sudden and largest decline since the government began tracking the data in 1939.
Those losses follow steep cutbacks in March as well, when employers slashed 870,000 jobs. Those two months amount to layoffs so severe, they more than double the 8.7 million jobs lost during the financial crisis….
The unemployment rate soared to 14.7% in April, its highest level since the BLS started recording the monthly rate in 1948. The last time American joblessness was that severe was the Great Depression: The unemployment rate peaked at 24.9% in 1933, according to historical annual estimates from the BLS.

Here’s the scary part – the jobs situation is likely even worse than those absurd numbers indicate. This was shown in great detail in a FiveThirtyEight.com article from Amelia Thomson-DeVeaux and Julia Wolfe titled ”The Terrible Jobs Report Gets Worse The More You Read It”.
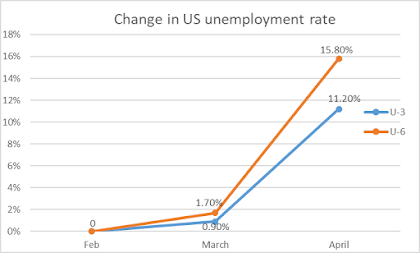
The real [unemployment rate] may actually be closer to that Great Depression peak, because by this metric, only people without jobs who have been actively looking for one are considered unemployed. In normal times, that’s already a bit of an issue because it means frustrated job seekers who have given up on finding something aren’t counted. Now, the problem is even bigger because so many workers are being encouraged to stay home to combat the coronavirus. Others might not be job-hunting because they believe there’s no work to be had.Along those same lines, there has been a massive increase in the amount of UNDERemployed people as COVID 19 has broken out. We saw a hint of this in March, when the U-6 “underemployment” figure grew by nearly twice as much as the headline U-3 number, and that gap got even wider in April.
“Job search is going to be tough when it’s a public health risk to be in contact with people and whole sectors of the economy is effectively shut down,” said Nick Bunker, a labor economist at the hiring site Indeed. “So lots of people who are out of work are probably not going to be included in the unemployment rate.”
Then there’s the possibility that some people may have been counted as employed even though it might be more accurate to say they’re temporarily out of work. The misclassification may have happened because of the way workers are surveyed — if they say they were absent from work during the entire week that’s referenced in the survey, interviewers follow up and ask why. Usually, the reasons fall into a standard set of buckets — vacation, childcare responsibilities, illness. But the number of workers who said they were absent from work for “other reasons” skyrocketed once the pandemic started, indicating that some people who had actually been furloughed may have misunderstood the question and answered in a way that indicated they were still employed.
This was a problem the BLS ran into in March, and again in April. In March, the researchers estimated that about 1.4 million people may have been misclassified as employed when they were actually temporarily out of work due to the pandemic; this month, it’s a whopping 7.5 million people. According to the BLS, the April unemployment rate would have been almost 5 percentage points higher if these people were included.
That underemployment also shows up in the hours worked category, which has some crazy variances. Goods-producing industries had a notable decline, and few industries had any gains in hours worked, but the overall average of private sector hours worked actually went up.

How did this happen? Because nearly 40% of the 19.5 million private sector jobs lost in the leisure/hospitality sector, which is filled with part-time waitstaff, bartenders and hotel workers. While construction and manufacturing had sizable job losses along with their loss of average hours, the jobs that remained still averaged 37.8 and 38.3 hours a week, respectively. So that drives up the average.
The cut in jobs and reduction of hours in higher-paid sectors also gave some wild variations in average hourly wages and average weekly wages, both of which went up overall. Except for the goods sectors, who say weekly wages crash.
1 month change, April 2020
Average hourly wages +4.7%
Average weekly wages +5.0%
Avg weekly wage - Mining -3.8%
Avg weekly wage - Construction -3.2%
Avg weekly wage - Manufacturing -2.6%
Again, you're seeing the effect of major losses of of low-pay and part-time jobs in some service sectors. What jobs are left pay more on the average, but you gotta have the job in the first place, and some higher-paid sectors are seeing wages drop.
With all of this brutal job news, let’s look at what Wall Street thought of it.
Major U.S. stock indexes jumped on Friday and logged solid gains for the week after data on historic job losses due to the coronavirus crisis showed they were slightly fewer than feared.....#headdesk
The U.S. economy lost 20.5 million jobs in April, the Labor Department reported. Economists polled by Reuters had forecast payrolls diving by 22 million, but the decline still marked the steepest plunge since the Great Depression.
“It’s tough to call the jobs report, which is what everybody was waiting for, anything but a complete calamity, but relative to expectations you can see some silver linings in there,” said Brian Nick, chief investment strategist at Nuveen, pointing to the large number of temporary layoffs.
These idiots think the worst is over, and that we’ll somehow regain these 20 million jobs just as soon as the economy reopens. But opening up the economy doesn’t mean that Americans will be opening up their wallets any time soon. If consumers aren't spending, this economy will remain in these multi-year depths for a lot longer than these coked-up fools think it will.
The Wall Streeters also aren't accounting for the millions of unemployment claims and furloughs that have come in since then. Yes, it can get worse, and May’s jobs report likely WILL be worse.
No comments:
Post a Comment