Tuesday, November 10, 2020

Even as we recover, more Wisconsinites are in need of Medicaid

An odd paradox of the COVID World in Wisconsin is that while more than half of the lost jobs have come back since April, the number of Wisconsinites requiring assistance keeps going up. One example of this is in Medicaid enrollments, which are up by nearly 170,000 since COVID started breaking out in March.
Digging inside the numbers, some of the increase in Badgercare enrollments in recent months has been driven by childless adults, whose enrollments have consistently grown and is now past 200,000. Another area that has had significant recent growth is in income extensions, which is a 12-month transition that goes to Badger Care recipients whose incomes have risen above the poverty line. The number of Wisconsinites on income extensions have jumped by nearly 25% in the last 3 months, and likely reflects people coming back to work, but still needing Badger Care for insurance.
Another BadgerCare program seeing more enrolles is the Senior Care drug program, with enrollment going from just over 95,000 at the start of 2020 to more than 99,000 in October. Senior Care was also in the news this week for another reason – a GOP complaint that seniors couldn’t get their COVID treatments paid for.
The Wisconsin Department of Health Services has not expanded the state's popular SeniorCare program to include coverage for vaccines, despite being required under a bipartisan law and as flu season begins while the coronavirus ravages the state.

Republican lawmakers are demanding an explanation from Department of Health Services Secretary Andrea Palm, calling the delay an “unnecessary roadblock for seniors looking to protect themselves from infectious diseases.”...

The state could fund vaccinations provided through SeniorCare while it waits for approval from the federal government to help cover the costs, [Joint Finance Co-Chairs Rep. John] Nygren and [Alberta] Darling wrote. The vaccinations are expected to cost about $80,000 a year.
Not a bad idea, especially since it would make things a lot easier for Senior Care recipients to know that they're covered for the vaccinations.

But the kicker/reality comes in at the last paragraph of the article.
Palm said in an Oct. 19 letter to Nygren and Darling that before the expanded coverage could be implemented, the Legislature's budget committee needed to approve an amendment to the SeniorCare program so it could get federal reimbursement. That approval was given last week.
In other words, Nygren and Darling were complaining about something that they had the power to act on, but chose not to.

Nice try

Even worse, the only reason that DHS had to wait on the GOP-run JFC to sign off on that change to SeniorCare was because of the lame duck laws that Republicans passed after the last time they lost a state election. So all of the delays are the direct result of GOP decisions, but they shamelessly are trying to blame Evers for it. Pathetic.

One other item to remember on Medicaid is that at the end of 2020, state taxpayers will have to take on 6.2% more of the expenses associated with these higher enrollments. That’s because the extra help the Feds gave states for Medicaid in CARES will run out, and if the Legislature continues to avoid expanding Medicaid under the Affordable Care Act, those extra costs are going to cause a significant squeeze in the 2021-23 budget.

The increase in Medicaid enrollments in Wisconsin hasn't hit our state budget yet, and has largely been ignored in light of the breakout of COVID-19 and the November elections. But the fact that more Wisconsinites conitinue to need assistance should tell you that the economy isn't going as great as some might think, and with the prospect of a nuclear winter looming for the restaurant industry and brick-and-mortar retail, it's going to be something that state lawmakers are going to have to deal with soon enough.

Sunday, November 8, 2020

COVID keeps getting worse in Wisconsin, so WisGOP springs into action against...voting?

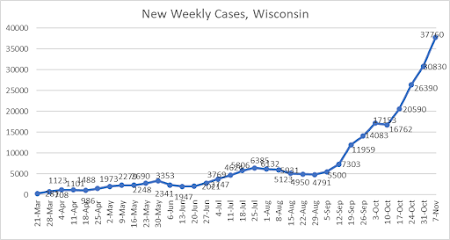
The election has been a convenient distraction from the increasingly worsening COVID 19 breakout in Wisconsin. The lst 7 days have seen cases expand to record levels, topped off by this report yesterday. The rest of the first week of November also had bad COVID news for Wisconsin. Cases averaged well over 5,000 a day, deaths also hit new highs, and more than 30% of the Wisconsinites tested in each of the last two weeks have ended up with a positive test.
But now that the election's over, it looks like WisGOP is finally deciding to end their 200-day paid vacation, and get to work on the important stuff.
Assembly Speaker Robin Vos (R-Rochester) released the following statement about his request to the Assembly Committee on Campaigns and Elections and its chair, Representative Ron Tusler (R-Harrison).

“I am directing the committee to use its investigatory powers under Wisconsin SS 13.31 to immediately review how the election was administered. With concerns surfacing about mail-In ballot dumps and voter fraud, Wisconsin citizens deserve to know their vote counted. There should be no question as to whether the vote was fair and legitimate, and there must be absolute certainty that the impending recount finds any and all irregularities.
These "concerns" came from the same RW media/Facebook cesspool that has been misinforming rubes about COVID-19, and not telling them how serious the situation is. Any wonder why things are this bad in Wisconsin?

And almost all of these WisGOPs that's fought every measure by the Evers Administration to try to control this pandemic got re-elected. So explain to me how we are going to crush COVID in the coming months, if the citizenry in red Wisconsin continue not to care to vote in favor of their own health and survival? And how much longer are we going to accept these dimwits to keep screwing it up for the rest of us?

Saturday, November 7, 2020

Jobs are still coming back. But still a long way to go

While many of us spent the last few days going over election results and waiting for networks to confirm what we (AND THEY) all knew to be true (BYE DONNIE!), some serious jobs news came in over recent days.

The first was Thursday's unemployment claims report, which told us that on the week before the election, the trend of claims continued to decline, but the totals weere still high.
In the week ending October 31, the advance figure for seasonally adjusted initial claimswas 751,000, a decrease of 7,000 from the previous week's revised level. The previous week's level was revised up by 7,000 from 751,000 to 758,000. The 4-week moving average was 787,000, a decrease of 4,000 from the previous week's revised average. The previous week's average was revised up by 3,250 from 787,750 to 791,000.

The advance seasonally adjusted insured unemployment ratewas 5.0 percent for the week ending October 24, a decrease of 0.3 percentage point from the previous week's unrevised rate. The advance number for seasonally adjusted insured unemployment during the week ending October 24 was 7,285,000, a decrease of 538,000 from the previous week's revised level. The previous week's level was revised up 67,000 from 7,756,000 to 7,823,000. The 4-week moving average was 8,244,500, a decrease of 827,250 from the previous week's revised average. The previous week's average was revised up by 18,500 from 9,053,250 to 9,071,750.
It's in the right direction, but still a long way to go before we even get down to the Great Recession peaks of 665,000 new claims and 6,635,000 continuing claims.

Positive news is also in the report when you see that the number of Americans on the contractor-heavy PUA program continues to decline, so the overall number of people collecting unemployment claims is down below 21 million.
However, note the rise in the gray part of that graph. A lot of the recent "decline" in continuing claims simply reflects people having their 26 weeks of regular unemployment run out. Many of those individuals continue to transition to the "extended claims" part of the unemployment program, with the number of people on extended claims rising by more than 2.5 million over the last 5 weeks.
This increase of long-term unemployed was also reflected in Friday's jobs report. You can see the growth in the orange and then gray parts of this graph as we got 15 and then 26 weeks out from the start of COVID-19 breaking out in the country in March.
However, the number of people listed as unemployed in Friday's monthly jobs report continued to fall, and by a significant amount.
In October, the unemployment rate declined by 1.0 percentage point to 6.9 percent, and the number of unemployed persons fell by 1.5 million to 11.1 million. Both measures have declined for 6 consecutive months but are nearly twice their February levels (3.5 percent and 5.8 million, respectively).
This is quite a different number than the 21 million people we still see filing unemployment claims, but the household survey only tells us if those individuals didn't work at all in tbe month of October. And it seems plausible that more people are finding jobs than the number of people stilll being laid off, and that there are at least some people heading back to work after being unemployed.

I thought the payrolls part of the October jobs report was surprisingly good, especially given that many Census jobs ended in that month.
Total nonfarm payroll employment rose by 638,000 in October, and the unemployment rate declined to 6.9 percent, the U.S. Bureau of Labor Statistics reported today. These improvements in the labor market reflect the continued resumption of economic activity that had been curtailed due to the coronavirus (COVID-19) pandemic and efforts to contain it. In October, notable job gains occurred in leisure and hospitality, professional and business services, retail trade, and construction. Employment in government declined.
Emnployment in government declined by a lot, and not just because of the winding down of Census work. Both higher education (at the state level) and local schools took major hits in October. October jobs change, US
Total jobs +638,000
Private sector jobs +906,000

Government jobs -268,000
Federal Government -138,000
Census -147,000
Other Fed Govt +9,000

State govt -65,000
Education -61,400
Other state govt -3,700

Local govt -65,000
Education -97,800
Other local govt +33,300

Keep that in mind as we get back to talking about policy and stimulus measures in the next few weeks - state and local governments are in big trouble, especially as CARES money runs out at the end of this year.

On the private sector side, the jobs picture continued to (slowly) rebound. But we're still down 8.9 million private sector jobs from where we were pre-COVID, and more than 10 million jobs overall.
A big positive in the report was strong hiring in both construction (+84,000) and manufacturing (+38,000). Both sectors are still below where they were pre-COVID, but they're not as bad as most other parts of the economy, and it helps explain why Trump was able to sell an argument of "improving economy" to a lot of blue-collars (whether it was true or not).
On the service side, there were some good gains in retail trade (+103,700), and bars and restaurants (+192,200). However, bars and restaurant employment is far below its February peak, as are hotels and other accomodations and entertainment/arts-related jobs.
In addition, the seasonally-adjusted "gains" in September and October shown in the last chart actually reflect lower-than-normal layoffs....because those layoffs already happened several months ago.

So on the day where the 2020 election was called for Joe Biden over Donald Trump, it looks like we had a jobs market where gains were still rolling in, but we still were in a massive hole caused by the COVID-19 induced recession, with many sectors still depressed. And with jobless claims remaining high, winter rolling in (the 70-degree weather ends after Monday, I'm afraid), COVID cases continuing to climb, and a whole lot of election-related activity going away, you wonder if October was the last really good jobs report that we'll see for a while.

Friday, November 6, 2020

A few thoughts from Wisconsin's election results

After a way-too-late Tuesday night and Wednesday morning, I've had a few days to digest another close statewide election in Wisconsin where Republicans overperformed their poll numbers. And I'll give a few bits of info to look into how Joe Biden won our state.

The first item I'll go into turnout, which is something I was wrong about. I said on Monday that if Biden got 1.6 million votes in Wisconsin, Trump had no chance and Biden would win easily. That wasn't the case, as Trump ended up getting more votes than any Republican has ever gotten in Wisconsin.
Add in the third-party tallies, and turnout was nearly at 3.3 million votes, shattering the state record by more than 200,000, and going up by more than 10% compared to 2016. These increases were widespread throughout the state with one exception - the City of Milwaukee, which didn't see any additional turnout at all.
As a result, the City of Milwaukee had a much smaller share of the total vote compared to recent elections, and the increased turnout in the rest of the state diluted some of the influence of the high-turnout areas of Dane County and the WOW Counties.
As for how those areas voted, it's a repeat of the trends we've seen in the Trump era. Big cities and their suburbs continued to trendi more toward Democrats, and more rural areas trending even more Republican. In fact, only 2 counties in Wisconsin flipped compared to 2020 - Sauk and Door Counties, which went for Biden after going for Trump 4 years ago.
But there were notable shifts beyond those two counties that turned from red to blue. Craig Gilbert broke down some of these changes in the Milwaukee Journal-Sentinel, and it shows keys to Biden's victory was in Dane and Milwaukee Counties - but not necessarily the big city.
• The city of Madison. Hillary Clinton won Madison by 63 points and about 97,000 votes. Biden won Madison by about 70 points and almost 113,000 votes. That’s a net gain for Democrats of almost 16,000 votes. • The Madison suburbs. Clinton won the rest of Dane County by 32 points and about 49,000 votes. Biden won these mostly suburban voters by 37 points and about 68,000 votes. These are blue suburbs getting bluer (and increasing in population). They generated a net gain for Democrats of more than 19,000 votes. • The Milwaukee County suburbs. Setting aside the city of Milwaukee, Clinton won the rest of Milwaukee County by 10 points and more than 19,000 votes. Four years later, Biden won the same turf by 17 points and almost 37,000 votes. That’s a net gain for Democrats of more than 17,000 votes.
There was one other area where Biden improved from Clinton - the red-voting WOW Counties, where Biden ended up with nearly 38% of the vote, compared to the low 30s figures that Barack Obama, Hillary Clinton, and Tony Evers pulled in the 2010s.
In the rest of the state, Biden did worse than Barack Obama did in President 44's 2 sizable wins in Wisconsin. But he did improve on Clinton's results in 2016, and ended up in line with what Evers did in the Fox Valley and in Racine/Kenosha. However, Biden did lose ground outstate vs what Evers did in 2018.
So what did we find out? That Trumpism repelled a lot of people in higher-population and highly educated parts of Wisconsin, but that it works with far too many people in all other parts of the state. And even though I'm glad that we don't have to be slurred as a red state for the next few years, knowing that there are so many that went along with this destructive, incompetent ogre is something I am not going to forget nor forgive.

The arrogance and refusal to admit facts with Wisconsin GOP voters went to a new level with Walkerism, got worse in the Age of Trump, and it's going to require a lot of deprogramming and direct confrontation for us to ever get back to the great state we thought we had a decade ago. But at least we know there's slightly more of us than there are them, and that's a start.

Tuesday, November 3, 2020

So what should we look at as Wisconsin's votes come in?

I've read far too much 538 for my own good in the last few weeks, and I don't need to be going over polls any more. But I do want to talk about some key numbers to look for as the votes come in, and some benchmarks to compare them to. Remember that there are two dimensions to consider when analyzing Wisconsin election results - the percentages that parties pull in various parts of the state, and turnout in various parts of the state. The Journal-Sentinel's Craig Gilbert had a good breakdown of Wisconsin’s turnout in presidential elections in an article today, and he notes that Wisconsin is among the many states that have had huge amounts of votes already put in the bank.
As of Monday morning, the day before the election, 1,886,533 absentee ballots have been returned. That’s equal to 63% of this state’s total vote four years ago. Since we haven’t had a modern election in a pandemic, we’re in uncharted territory. Those numbers suggest (but don't guarantee) turnout will be higher than in 2016. Nor do they tell us who is going to win battleground Wisconsin. But they do underscore how much voting behavior has changed because of COVID-19. Far more than half the vote has been cast before Election Day. In some other states, early turnout has already exceeded the total vote in 2016…. The nearly 1.9 million absentee ballots cast in this election equals 51% of the state's registered voters. The counties with the highest share of registered voters who've already voted is a list of politically vital and populous southern Wisconsin counties where both parties heavily mobilize: Dane (63.6%), Ozaukee (63.1%), Waukesha (62.9%), Brown (58.5%), Washington (58.4%), Racine (56.8%), Milwaukee (56.4%) and Kenosha (56.3%).
To go along with that last paragraph, Gilbert also included this map, which compares the early vote totals (as of Sunday) with the total votes cast in 2016. And you can see that the highest-population areas of Wisconsin have been the ones with the highest percentage of absentees cast, led by Dane County's 80%. On the flip side, many rural counties didn't even have half or even a third of their 2016 totals in as of yesterday.
As for the statewide totals, the Wisconsin record turnout for a presidential election is 3,068,000 votes, which happened in the 2012 election between Barack Obama and Mitt Romney. If we exceed that, and end up with 3.1 million votes, that's still less than 1.25 million votes being cast today - less than 1/2 of all votes in the November 2018 elections (which I will also include when looking at share of turnout).

So how many people are actually voting today? If the Madison polling place I worked at this morning is any indication, there will be few if any lines of people waiting to vote and to cast ballots, which means that absentees will be getting processed sooner than a lot of people may have feared. For example, Madison is on target to largely be done processing absentees by the time polls close at 8pm (knocks on wood). And it makes day-of voting a whole lot easier, lessening a barrier that many run into on Election Day.

The places where those 3.1 million or so votes are coming from is also key. I've broken down the state of Wisconsin into 7 different areas to analyze that.

1. The City of Milwaukee
2. The rest of Milwaukee County outside of the City of Milwaukee
3. The Republican "WOW County" suburbs of Waukesha, Ozaukee, and Washington
4. The very blue Dane County
5. The 3 higher-population counties in the Fox Valley - Brown, Outagamie and Winnebago, or the "BOW Counties"
6. The key Obama-Trump counties of Racine and Kenosha in the SE corner of the state
7. The other 62 counties in the state, which make up a little less than 1/2 of the state's votes

And while the breakdown of vote share in these different areas is relatively stable across the presidential years of 2008, 2012, and 2016, and in the governor's race of 2018, you will notice that the City of Milwaukee took up less of the vote in the non-Obama elections of 2016 and 2018, and the WOW Counties and (especially) Dane County have become more of the electorate.

Narrowing it down to presidential years and the top 10 counties, you'll see that all of these areas had increased turnout in 2012, but all except Dane County had fewer votes in 2016, with the biggest dropoff coming in the very blue City of Milwaukee - a big reason behind Hillary Clinton's loss of 23,000 votes.
So for tonight, Biden obviously wants to restore that 40,000 vote dropoff that happened in the City of Milwaukee in 2016. But let's also see if Dane County continues to increase its turnout, and to see if all other areas rebound in the intense year of 2020.

Now let's look at the second dimension - how percentages in various places break down across the state. The 10 counties I've separated out from the rest of the state consistently make up 53-55% of Wisconsin's total vote, and let's note how those votes have broken in those 4 elections. We'll start with the big 4 counties around Milwaukee, and Madison-centered Dane County.For this, I will also include the 2018 Governor's election, where Tony Evers beat Scott Walker by just over 1%.

You'll see that the percentages the two major parties receive hasn't changed too much over those 4 elections. The exceptions are Obama's comparatively strong performance in the red-voting WOW Counties in 2008, and Dane County's pro-Dem bump by 4 points in 2018 helped put Evers over the top vs Walker.

Where the real changes in percentages have happened in these 4 elections were in the rest of the state. In 2012, Obama lost between 2-5 points in the 3 other portions of Wisconsin I've set aside (BOW Counties, Racine/Kenosha and everywhere else in the state), which is in line with him getting 56% in the statewide totals for 2008, and then 53% in 2012.

However, Hillary Clinton collapsed in these areas in 2016, failing to even pull 40% outstate, getting barely more than 41% in the BOW Counties, and less than 46% in Racine/Kenosha after Obama easily won those areas in both 2008 and 2012. Evers did better in 2018 in these places, but still lost all of them to Walker.
If Biden can fight Trump to a draw in the BOW and Racine/Kenosha and even pull 45% outstate, not only will Trump lose Wisconsin, he will lose decisively and in a way that often translates into downticket wins for Dems. And that can be done by a Democrat in a statewide election, even in polarized 2020. US Senator Tammy Baldwin had this map when she hammered Leah Vukmir by 11 in 2018.

So look to the BOW and Racine/Kenosha, as that will likely tell us if Trump can pull a repeat of his 2016 shocker (see Hillary 2016 totals), a decent-sized win (see Obama 2012), or a double-digit blowout (see Baldwin 2018). And let's see if the "suburban women/men with college degrees hating Trump" trend shows itself in a change in percentages in the WOW Counties or the MKE burbs. If so, it has huge implications at the state level.

Also, if we get the 3.1 million+ turnout that is seeming more likely by the day, that will likely sink Trump as well. As I've said before, no Republican in Wisconsin has ever gotten more than 1.48 million votes in an election, and that was George W. Bush in 2004, WHO LOST WISCONSIN. I don't think Donald Trump will get more votes than Dubya did, so if turnout reaches 3.1 milion, Joe Biden is going to win this state, and if we get to 3.2 million votes, it'll be by a healthy amount.

Working the polls was a very good experience today for me, partly because it got me away from the wall of worry that exists online, and let me see the wide variety of people that make my hometown of Madison great. Yes, that even includes the camo MAGA hat guy who I allowed ahead of me as I was trying to run absentees so he could get his vote in and go on his way. I think I'll try to maintain that "ignore a lot of stuff" strategy throiugh around 7 or 8pm tonight, and enjoy the last strands of this unseasonably warm day.

Sunday, November 1, 2020

October's COVID numbers were horrifying. Will voters do something about it?

The closer we've gotten to this country's elections, the worse Wisconsin's COVID-19 pandemic has become. And last week's numbers were the worst yet by far. Over 30,000 Wisconsinites got new positive tests, and just as alarming is the fact that the Wisconsin Department of Health Services says the number of people tested went down significantly last week. This means that of the Wisconsinites tested for COVID last week, over 30% (!) of them tested positive.
And as anyone could have sadly predicted when COVID cases started growing in September, October had a horrifying number of COVID deaths in Wisconsin. Over 700 Wisconsinites died of COVID in October, pushing the reported death toll past 2,000 on Halloween Day.
The quickening of COVID deaths in the state is so much that I think many of us can't comprehend how bad it has gotten. Through September, it had taken at least 9 days to have 100 additional deaths reported in Wisconsin. In October, we consistently saw 100 new deaths be reported in 3 days.
And yet a large number of Wisconsinites and basically the whole Wisconsin GOP has tried to ignore this disease and its breakout ahead of the election. So things have continued to get worse, and the state's economy will continue to be handcuffed as people aren't going to be willing to go to certain places because they don't want to be one of those COVID statistics.

There's no way this gets better until there are consequences given out to the WisGOPs that turned a blind eye to this mess, or worse, tried to sue the Governor any time he tried to do something about it. And unless Wisconsinites make EVERY ONE OF THEM PAY THIS WEEK for allowing this unneeded death and strains on our health system, it's not going to get better. Which will make for a horrid, depressing winter in a place where winters are already rough enough.

Sunday reading - Milwaukee's long-term economic struggles continued in Fitzwalkerstan era

Wanted to forward the results of a study from Marquette University and republished in the Milwaukee Journal-Sentinel late last week. It's from former news anchor Mike Gousha and researcher John Johnson, and looks at how the economy has changed in Milwaukee and other Midwestern metros in the last 40 years, and how they have performed.

The study uses Census Bureau definition of Milwaukee metro as Milwaukee County and the three WOW Counties (Waukesha, Ozaukee, and Washington), and Gousha and Johnson notes that both the City and suburbs have declined in inflation-adjusted incomes since 1980, but the City has fared worse for declines in income, popultion, and jobs in the metro area.
In 1980, 31% of the residents of metro Milwaukee lived outside Milwaukee County. Today, nearly 40% do. But the WOW counties’ evolution from commuter suburbs to full participant in the metro economy is the bigger story. In 1980, 15% of metro Milwaukee’s jobs were in the WOW counties. Today that number is 42%.

But what about the region’s relative prosperity?

In 1980, the nation’s median household income was $54,000. The city of Milwaukee closely mirrored that number, at $53,000. But by 2018 — the last year for which data was available — the nation’s median household income had grown to $64,000. The city’s household income had fallen to $44,000.

The city’s suburbs and surrounding areas remain relatively prosperous compared to the rest of the nation, and especially the city. But even their median household income today — $73,000 — is $5,000 less than it was in 1980.
The study uses 10-year benchmarks for incomes (except for the 2010-2018 time period), which includes the peak income year of 2000 and the Great Recession depth of 2010. And while Madison and the Twin Cities metros have thrived and gained back most of their losses of the 2010s, incomes and jobs in Milwaukee and other former industrial powers in the Midwest are far behind.
The story of household income in metro Milwaukee bears some resemblance to other Midwestern cities, but not in a good way. In real dollars, Detroit and Cleveland have also seen their median household income decline since 1980, and by an even larger amount than Milwaukee.

Some other Midwestern metros have fared better. Household income for metro Indianapolis is the same as it was in 1980. The Chicago, Kansas City, and St. Louis metro areas have seen a modest increase, while Madison and Minneapolis have seen significant gains.

As we reported in June of this year, metro Milwaukee’s population has been in a slow or no-growth mode since 2000. That is reflected in employment numbers. Despite two recessions in the 2000-2010 decade, the Minneapolis, Indianapolis, and Kansas City metro areas all added tens of thousands of employees to their economies from 2000 to 2019. The Minneapolis-St. Paul metro added 235,000. Indianapolis added 201,000. Both had such strong population and jobs growth that their metro areas physically expanded. Kansas City added 92,000 employees.

In contrast, metro Milwaukee lost more than 6,200 employees during that period. That performance ranked Milwaukee 309th out of 352 metro areas, but it was still better than Detroit, which lost 152,000 employees, and Cleveland, which lost 87,000.
In that map, you can see that Milwaukee was hammered hard in the 2000s, with median household income dropping by more than $12,500 after inflation vs the Twin Cities' decline of $10,400 and Madison's decline of a little over $8,000. And Milwaukee also lagged those two metro areas in the 2010s, both in income growth and in jobs.

Change in inflation-adjusted income, metro area 2010-2018
Twin Cities +$7,750
Madison +$4,062
Milwaukee +$3,400

Change in total jobs, Dec 2009 - Dec 2019 (QCEW)
Hennepin Co. (Minneapolis) +140,124 (+17.4%)
Ramsey Co. (St. Paul) +19,593 (+6.2%)

Dane County (Madison) +53,665 (+18.1%)
WOW Counties +44,694 (+14.7%)
Milwaukee County +19,559 (+4.0%)

So perhaps that whole WisGOP strategy of "handcuff Milwaukee and encourage more economic apartheid" isn't something that worked out well in the 2010s. Sure, the WOW Counties did better than Milwaukee County, but they're still underperformed the other 2 peer metros in the Upper Midwest, and now that 2020 and the COVID pandemic has hit, any of those gains of the 2010s are likely to be wiped out.

So maybe it's time for different leadership at the State Capitol, if we really want the state's largest metro area to try to catch up to the gains that the Mad City and the Twin Cities have had over the last 40 years. Because using "Milwaukee" as code for race-baiting, and a place to disinvest from (outside of sports arenas) has kept that metro area behind. And it's kept our state behind.