In addition to the big (seasonally-adjusted) increase in January, the other big news to me was the annual benchmark revisions for the monthly jobs reports for all of 2021. And they had some big changes.BREAKING: The US economy ADDED 467,000 jobs in January despite the Omicron wave. This is way higher than expected.
— Heather Long (@byHeatherLong) February 4, 2022
Big gains in leisure and hospitality, which added 151,000 in January.
The unemployment rate is 4% (slightly up from December, but for good reasons = more searching
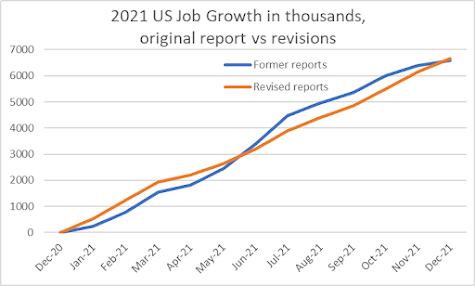
Here's another way to look at the effect of these revisions. What it shows is that job growth was more consistent in 2021 than previously reported. This made the growth larger in the Winter, lower in the Spring and Summer, and larger again as 2021 ended.The big takeaway from the jobs report = The US jobs market is even stronger than we thought.
— Heather Long (@byHeatherLong) February 4, 2022
+476,000 jobs added in January
+510,000 jobs added in Dec. (prior estimate was 199k)
+647,000 jobs added in Nov. (prior estimate was 249k)https://t.co/tfSauSW55K pic.twitter.com/ZA2WmY3j43
In accordance with annual practice, the establishment survey data released today have been benchmarked to reflect comprehensive counts of payroll jobs for March 2021. These counts are derived principally from the Quarterly Census of Employment and Wages (QCEW), which counts jobs covered by the Unemployment Insurance (UI) tax system. The benchmark process results in revisions to not seasonally adjusted data from April 2020 forward. Seasonally adjusted data from January 2017 forward are subject to revision. In addition, data for some series prior to 2017, both seasonally adjusted and unadjusted, incorporate other revisions.... As part of the benchmark process, the seasonal adjustment models are also updated. These models remove normal seasonal fluctuations—such as regular employment changes due to major holidays — from the data series, making it easier to observe cyclical and other economic trends. Now that there are more monthly observations related to the historically large job losses and gains seen in the pandemic-driven recession and recovery, the models can better distinguish normal seasonal movements from underlying trends. As a result, some large revisions to seasonally adjusted data occurred with the updated models; however, these monthly changes mostly offset each other. For example, the over-the-month employment change for November and December 2021 combined is 709,000 higher than previously reported, while the over-the-month employment change for June and July 2021 combined is 807,000 lower. Overall, the 2021 over-the-year change is 217,000 higher than previously reported. Going forward, the updated models should produce more reliable estimates of seasonal movements. Table A presents revised total nonfarm employment data on a seasonally adjusted basis from January to December 2021.The household survey that determines the unemployment rate also was affected by COVID as well as information from the recently completed US Census. And it ended up in mostly positive changes.
Effective with data for January 2022, updated population estimates were incorporated into the household survey. Population estimates for the household survey are developed by the U.S. Census Bureau. Each year, the Census Bureau updates the estimates to reflect new information and assumptions about the growth of the population since the previous decennial census. The change in population reflected in the new estimates results from the introduction of a blended 2020 population base, which combines population totals from the 2020 Census and demographic characteristics from other sources. It also reflects adjustments for net international migration, updated vital statistics, and estimation methodology improvements. The vast majority of the population change, however, is due to the change in the base population from Census 2010 to the blended Census 2020 base.... The adjustments increased the estimated size of the civilian noninstitutional population in December by 973,000, the civilian labor force by 1,530,000, employment by 1,471,000, and unemployment by 59,000. The number of persons not in the labor force decreased by 557,000. Although the total unemployment rate was unaffected, the employment-population ratio and labor force participation rate were each increased by 0.3 percentage point. This was mostly due to an increase in the size of the population in age groups that participate in the labor force at high rates (those ages 35 to 64) and a large decrease in the size of the population age 65 and older, which participates at a low rate.The key takeaway for me is that we are even closer to full capacity on employment than we knew, and there are now fewer people of retirement age for a sad reason - COVID-19 deaths. That should change a few evaluations about where our economy is, and what we should do going forward. It SHOULD, anyway.... There was on Omicron effect in the jobs report, mostly in a lower work week, which blunted a 23 cent/0.7% increase in average hourly wages (I'll touch on this in a later post). But the increase of wages is pretty widespread, especially at the lower end of the wage scale, which is beating the rate of inflation.
I'll also note that these 12-month wage numbers don't include the added INCOME that has resulted from child tax credit payments and stimulus checks, along with growth in asset prices among more secure Americans. Which partially explains our increased inflation but also contributed to the record job growth due to the increased demand. What these revisions tells me in 2022 is that the Biden stimulus measures of 2021 worked well, got us back to full employment. Now our challenge is to keep these jobs and make sure they pay better, maintain the higher incomes and lower poverty rates that happened in 2021, and increase workers' options and protections to lock in the gains that have resulted from this Biden Boom.This is telling: Yes, wages are growing quickly, but the only industry outpacing inflation is hospitality.
— Heather Long (@byHeatherLong) February 4, 2022
Y/y wage growth:
Hospitality: +13%
**Inflation 7%**
Biz +6.9%
Warehouse/transport +6.8%
(Avg for all jobs: +5.7%)
Retail: +5.4%
Manufacturing: +5.1%
Construction +5.1%
No comments:
Post a Comment